
How to value a stock, worked on Tesla
Most valuation articles explain one method in the abstract and stop. This one runs four frames on the same company, Tesla, with real numbers, and then adds the fifth frame that decides the question: your own assumptions, made explicit. The disagreement between the frames turns out to be the most useful output of the exercise.

How do you value a stock?
Not with one number. Every valuation method answers a different question, and the honest approach is to run several independent frames and pay attention to where they disagree. A multiple tells you what you are paying for current earnings. A discounted cash flow tells you what the business is worth if your forecast is right. A reverse DCF tells you what forecast is already baked into the price. A sum of the parts prices each business line on its own economics. When the frames agree, you know something. When they disagree, you know exactly which assumption the whole debate hangs on, and that is worth more.
Tesla is the perfect stock to work this on, precisely because it is the one where single frame answers fail hardest. To a multiples investor it has been uninvestable for a decade. To a growth investor the same decade returned about 20,000 percent. Both were reading one frame and calling it the whole book. So here is the whole book, four frames on the same company, using the numbers from Invest Board's Tesla analysis of August 2026, with the stock at $322.
How do you calculate the intrinsic value of a stock?
Intrinsic value is the discounted value of the cash an owner can actually take out of the business over its life. That is Buffett's definition (Invest Board shows the same number as fair value), and the practical difficulty is the phrase "actually take out". Reported free cash flow subtracts all capital spending, including the part that funds growth the owner chose to buy. Owner earnings adds the growth portion back: earnings plus depreciation, minus only the capex needed to maintain the existing business. For a company investing heavily in expansion, the two numbers are wildly different, and using the wrong one produces a wrong valuation with great confidence.
Tesla makes the distinction concrete. Reported free cash flow over the trailing year: about $5.8 billion. But of roughly $12.9 billion in capital spending, the analysis estimates only $6.5 billion maintains the existing business; the other $6.4 billion builds new factories, new compute, new products. Owner earnings, the number Buffett would start from, come out near $12.2 billion, more than double the reported figure. The test worth applying is the one Amazon taught the market in the 2010s: if the company stopped expanding tomorrow, would free cash flow explode upward? For Amazon the answer was yes, and everyone who valued it on reported FCF missed it. For Tesla the analysis says partially: real earning power is masked by growth spending, but a chunk of that capex is competitive necessity rather than choice, which is why the same analysis classifies Tesla as a capital intensive grower and scores its reinvestment quality a sober 3 out of 10.
Discount owner earnings instead of reported FCF and the multiple falls from roughly 200 times to roughly 100 times. Still expensive. But now you are at least valuing the right cash flow, and the remaining expensiveness has to be explained by growth, which is the next frame's job.
What growth is already priced into the stock?
Instead of forecasting cash flows and asking what the business is worth, a reverse DCF starts from the market price and asks what forecast would justify it. You hold margin and discount rate steady and solve for the revenue growth the price implies. Then the question stops being "what is my price target" and becomes "is that implied growth achievable", which is a question you can actually research: against history, against the addressable market, against what management has delivered before.
Run that on Tesla at $322 and the market is pricing roughly 18 percent revenue growth compounding for a decade at around 15 percent free cash margins. Neither number is insane in isolation; together they are a demanding pair, because Tesla's current margins sit well below 15 percent and analyst consensus for near term growth sits below 18. The analysis puts the gap between what is priced and what looks achievable at about minus 12 percent: modestly overvalued in this frame, not catastrophically so. The useful part is not the verdict but the specificity. You now know the exact bet the market is making, and you can argue with a number instead of a mood.
How do you do a sum of the parts valuation?
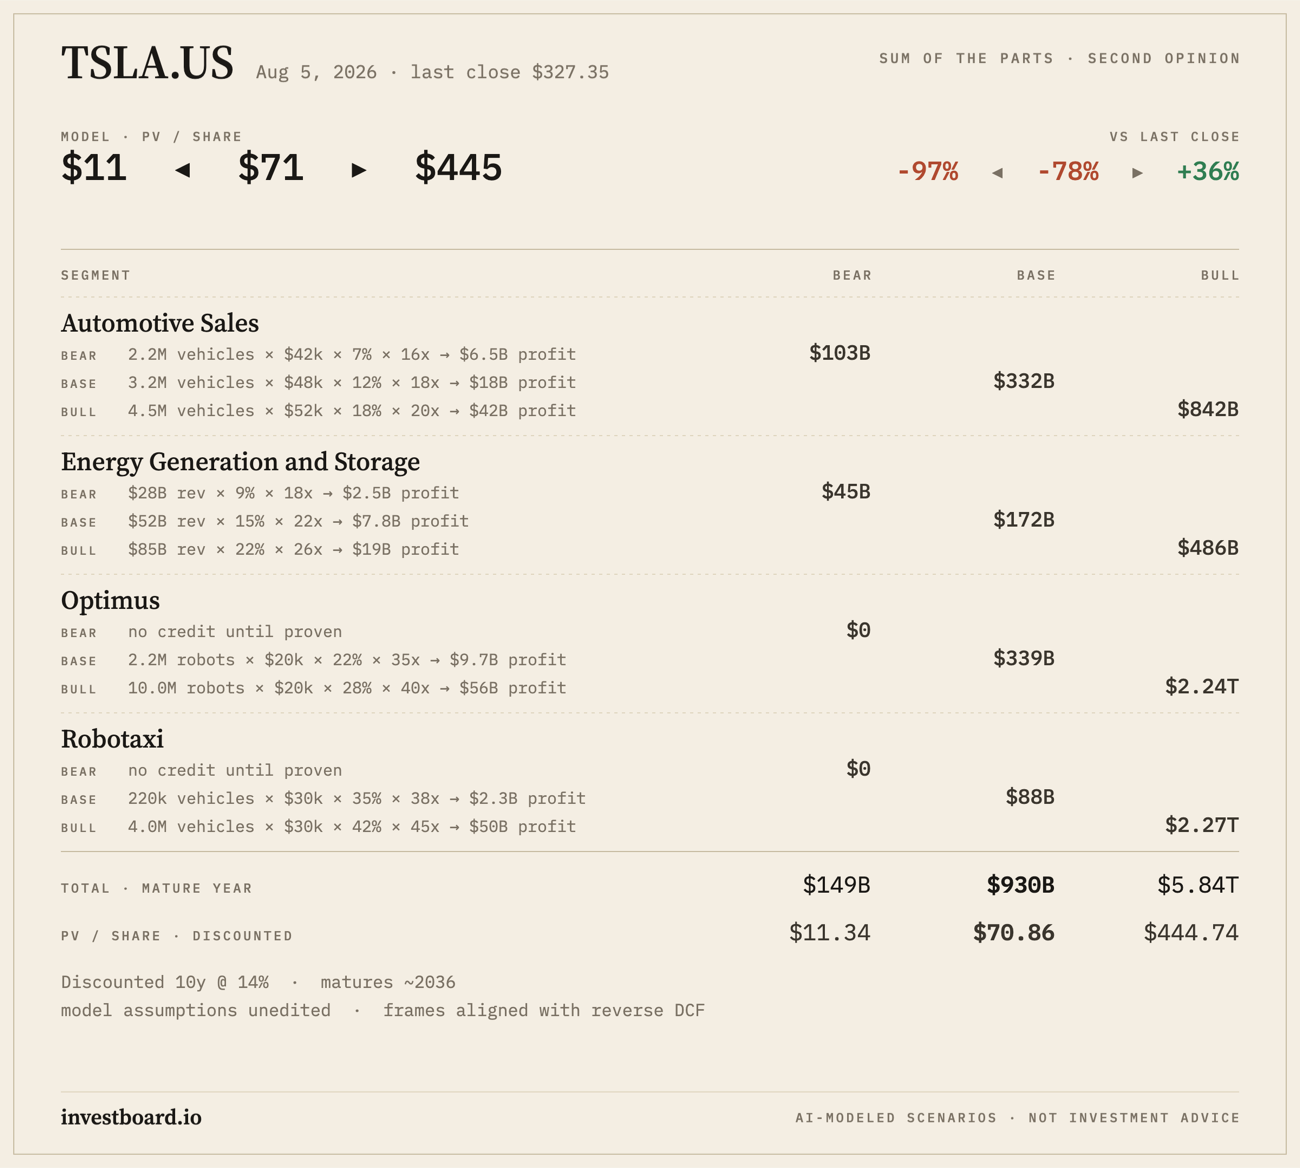
Break the company into its business lines and price each one on its own drivers: units sold times price per unit times profit margin times an exit multiple, or revenue times margin times multiple where unit data does not exist. Do it three times per segment, a bear case, a base case, and a bull case, then sum the parts and discount back to today at your cost of equity. The discipline that keeps it honest: every unit number must trace to a source, and pre revenue moonshots get a bear case of exactly zero, no credit until unit economics are proven.
The figure above shows the result for Tesla, with a 2036 horizon and every assumption visible. Automotive: 3.2 million vehicles at a $48k average price and 12 percent after tax margin, on an 18 times multiple, is a $332 billion segment in the base case. Energy: $52 billion of revenue at 15 percent margins on 22 times is another $172 billion. Then the options. Optimus takes Musk's stated ambition of 10 million robots a year, sourced from the 2025 shareholder meeting, and weights it by a 22 percent success probability in the base case: 2.2 million robots at $20k and 22 percent margins on 35 times, roughly $339 billion. Robotaxi anchors on the 1 million vehicle milestone written into the 2025 CEO Performance Award and reaches $88 billion probability weighted. Both options carry a bear case of exactly zero.
Sum the parts: $149 billion in the bear, $930 billion in the base, $5.8 trillion in the full success bull. Discount ten years at 14 percent over 3.54 billion shares and the per share range is $11 to $71 to $445 against a $322 price. The base case says the stock is worth about a fifth of what it trades for; the bull says it is worth 40 percent more. That spread is not a failure of the method. That spread is the information.
Why does Tesla's valuation make no sense to so many people?
Because they are looking at it through one frame. Tesla trades near $1.2 trillion against roughly $5.8 billion of reported free cash flow, which is about 200 times. In a single frame view that is absurd, and the case is closed. The sum of the parts view shows what the market is actually doing: it is not paying 200 times for a car company, it is pricing optionality in Optimus and robotaxi that currently produce nothing. Whether that makes sense depends entirely on the probability you assign to those options, and reasonable people can land anywhere between a $71 stock and a $546 one from the same table.
The table also settles the cleanest version of the bear case: what if Tesla is just a car company? Then the arithmetic is short and brutal. Automotive alone discounts to about $25 per share in the base case and $64 even in the full success bull. Add the entire energy business and the ceiling is still roughly $101, with a base case near $38. For $322 to make sense on cars alone, Tesla would need to sell about 40 million vehicles a year at current prices and margins, which is nearly half the world market, or earn margins above 100 percent on the 3.2 million it sells in the base case, which is not a margin, it is a typo. No achievable margin improvement and no plausible volume gets a car only Tesla to today's price, let alone to a margin of safety below it. In that frame the stock is not expensive, it is unownable above roughly $40. Which is precisely the point: anyone bullish at $322 is making an options argument, whether they say so or not.
This is where valuation stops being arithmetic and becomes judgment, and where a tool should hand the judgment back to you rather than hide it. In Invest Board the table above is editable cell by cell: set the Optimus and Robotaxi probabilities to full conviction, ease the discount rate from 14 to 10 percent, and the same arithmetic produces a base case of $546 per share, 69 percent above the price. The distance between $71 and $546 is three numbers: two probabilities and a discount rate. Every argument about Tesla on the internet is, underneath the noise, an argument about those three numbers. Naming them is more productive than shouting a price target.
Note also what the frames do when you line them up. The reverse DCF says modestly overvalued. The base case sum of the parts says substantially overvalued. Both point the same direction, which the analysis flags as agreement between frames, and the residual difference traces to how much probability weighted option value you allow into the base case. One line of reconciliation, and the whole disagreement is localised.
How do you evaluate a stock before buying?
Valuation is the last step, not the first. Before it: is the business inside your circle of competence, is there a durable moat, does management allocate capital well, and what kills the thesis. Write the kill criteria down before you buy, because after you buy your brain works for the position, not for you. Then demand a margin of safety between price and your value estimate, sized to how wide your bear and bull cases sit apart. A wide spread is not a reason to walk away, it is a reason to size the position small.
On Tesla, that discipline might read like this. The thesis is real world AI: autonomy and robotics monetising a decade of fleet data, with the car and energy businesses funding the option. The kill criteria are checkable: robotaxi unit economics failing to clear proof by a stated date, vehicle margins falling below your bear case, a competitor reaching autonomy at scale first. The margin of safety question is honest: at $322 you are paying above the probability weighted base of every frame, so a purchase today is a statement that your probabilities are meaningfully higher than the model's. That might be right. The point of the exercise is that you now know precisely what you are claiming, and you will know precisely when you are wrong.
One warning before any of the arithmetic: none of it substitutes for understanding. Every probability in the Tesla table is a claim about fleet data, manufacturing scale, inference hardware and execution culture, and you can only defend those claims if the company sits inside your circle of competence. The frames turn understanding into numbers. They cannot create the understanding.