
Reverse-DCF Explained
The most useful number a valuation model produces is the one the market has already put in. Reverse-DCF gives it to you in thirty seconds.

What is a reverse-DCF?
A reverse discounted cash flow takes the price the market is currently charging for a stock and solves backwards for the free cash flow growth rate the market is implicitly expecting. Instead of building your own growth forecast and asking whether the stock is cheap, you ask: what would the company have to do for the current price to make sense? Compare that to what the company has done historically and what its addressable market actually permits, and you get a much sharper signal than forward DCF.
The reason this matters is that a forward DCF is mostly a credibility exercise: the analyst projects what she wants the company to do, and the model dutifully produces a number that matches her bias. A reverse-DCF cannot be tortured the same way. The inputs are the market's, not yours. The only thing you get to evaluate is whether the market's implied expectation is achievable. That single question, asked honestly, is more useful than fifty pages of analyst notes.
What is a DCF, in plain terms?
A discounted cash flow values a business as the sum of all the cash it will ever hand its owners, discounted back to today because a dollar arriving in year nine is worth less than a dollar arriving now. In practice you forecast free cash flow for an explicit period (usually ten years), add a terminal value for everything after, and discount the whole stream at a rate that reflects your required return. If the total comes out above the current price, the stock is cheap by your assumptions. The model is the bedrock of intrinsic-value investing. Its weakness is that the output moves violently with small changes in growth and discount-rate inputs, which is exactly the weakness the reverse-DCF turns into a strength.
Hold both models in your head as the same equation read in opposite directions. Forward DCF: assumptions in, fair value out. Reverse-DCF: price in, assumption out. The second reading is the one that keeps you honest, because the market has already committed to its number and you get to audit it.
How is a reverse-DCF different from a forward DCF?
A forward DCF projects revenue, margins, capex, and taxes year by year, discounts them back, and produces a fair value. The output is a number you can compare to the market price, but the input is twenty assumptions you almost certainly got wrong. A reverse-DCF inverts the exercise: it takes the market's number as a given and solves for the growth rate the market is buying. The single input you have to evaluate (is this growth rate achievable?) is the same input that drives the forward DCF, but it's the only one in the room, so it gets the attention it deserves.
The canonical treatment of this idea is Expectations Investing by Alfred Rappaport and Michael Mauboussin. Their argument: stock prices are the clearest, most reliable signal of the market's expectations about a company's future performance, so the analyst's first job is not to forecast but to read the expectations already embedded in the price, and the second job is to judge whether the company will beat them. Mauboussin's image is a high jump. The price sets the bar. Your work is deciding whether the athlete clears it.
Bill Miller put it best: "100% of the information you have about any business reflects the past; 100% of its value depends on the future". That's the philosophical core of reverse-DCF. You don't get to skip the future-forecasting problem. You just get to compress it down to one number, name it, and stress-test it against history and addressable market. Forward DCF spreads the forecasting error across twenty inputs and lets you forget what you assumed. Reverse-DCF leaves the assumption naked on the page.
How do I actually run a reverse-DCF on a stock?
You need three numbers and one equation. Free cash flow over the last twelve months (use FCF, not earnings, since buybacks and accruals lie). The current enterprise value or market cap. A discount rate (most retail investors use 10%, which is fine as a starting point). The equation is the standard DCF inverted: assume a flat or smoothly-growing FCF over ten years, plus a terminal value at a long-run growth rate, all discounted at your rate. Solve for the growth rate that makes the present value equal the current price. Spreadsheets do this in thirty seconds with the goal-seek tool. The answer is the market's implied expectation. Now you have something to argue with.
The math is genuinely simple. A two-stage model with ten years of explicit growth and a terminal stage at 3% is enough for almost any retail use. Pick a current FCF figure that isn't distorted by a one-off (use a three-year average if the LTM looks fluky). Pick your discount rate. Use goal-seek (or a binary search in your head if you're old-fashioned) to find the explicit-period growth rate that makes the discounted cash flows sum to the current price. That growth rate is what the market is paying for.
The mental shortcut for sanity-checking the answer: if the implied growth rate is 5% and a company is growing 12%, the stock is probably cheap. If the implied rate is 25% and the company is growing 8%, the stock is paying for a story. Use the full process to decide whether the story is real.
What discount rate should I use?
For a quality-investing reverse-DCF, 10% is a sensible default for the equity discount rate: it captures the long-run real return on equities (around 7%) plus an inflation cushion. Lower it to 8% if you're modelling a high-quality, low-volatility compounder; raise it to 12% if the business is cyclical or capital-intensive. The point of the reverse-DCF isn't precision on the discount rate; it's precision on the growth-rate question the discount rate makes you ask.
The temptation among first-time DCF users is to over-engineer the discount rate. Resist it. The discount rate is the dial that lets the model produce any answer you want; the integrity of the exercise depends on holding it still. Pick a defensible rate, write it down, and never change it to make a stock you like cheaper.
How do I tell if the implied growth rate is reasonable?
Three tests. First, history: has the company grown FCF that fast over the last decade? If yes, you have a comp; if no, you need a story. Second, TAM: can the addressable market support that growth in absolute dollars? If a company implied at 25% FCF growth for ten years would be larger than its market by year five, the price is wrong. Third, peers: what is the next-best comparable doing? If the implied rate is higher than every peer, you are paying for the assumption that this company is the best in its category — which might be right, but you should know you are paying for it. The gap between the growth you believe is achievable and the growth the price implies is the growth cushion: positive means the business can outgrow what you are paying for.
The TAM test is the most punishing of the three. Run the maths: if the market is implying 25% FCF growth for ten years, the company at year ten is roughly nine times larger than it is today. Does the addressable market support that? In a $200B market with a market share of 5% today, you have room. In a $20B market with a market share of 40% today, you do not. The implied growth has nowhere to go, and the stock is paying for an answer the market can't supply.
Peter Lynch made his career on the inverse of this question: small companies with enormous TAMs and modest current penetration. The reverse-DCF translates the Lynch intuition into a number.
How Invest Board runs the reverse-DCF for you
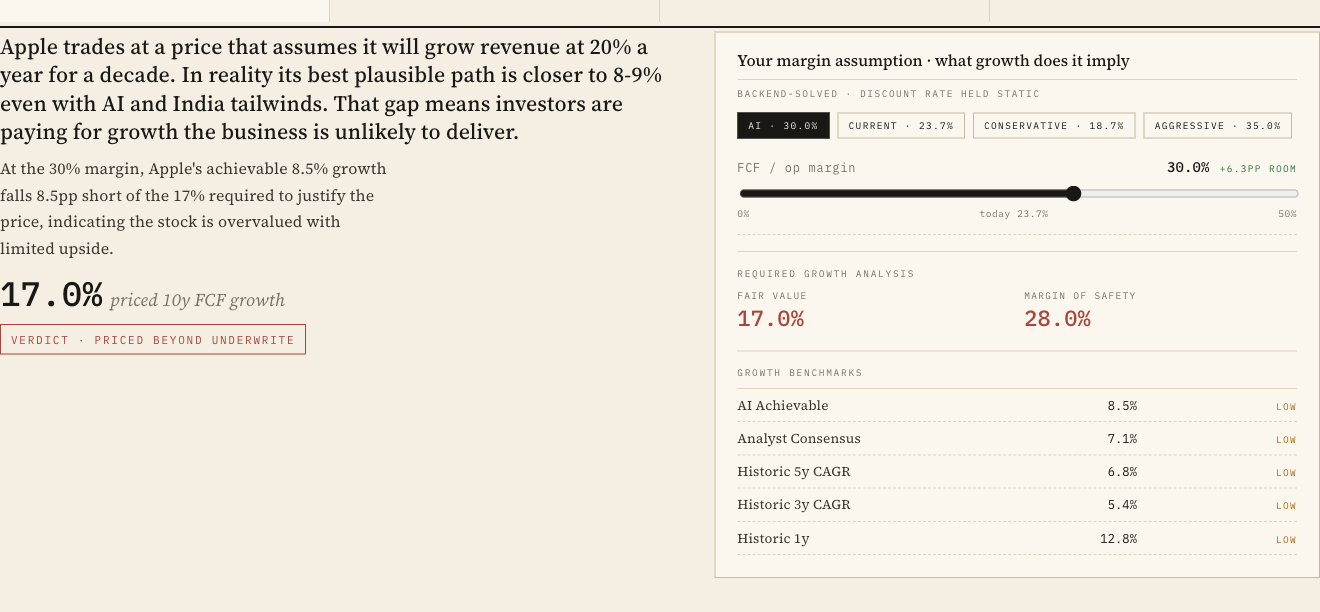
Everything above you can do in a spreadsheet. What a spreadsheet cannot do is keep the exercise honest at scale, so we built the discipline into the product. On every company page the valuation section opens with four standing reads: the current price with the growth rate it implies, the AI's fair value with the growth cushion in percentage points, the analyst consensus median price target, and the sceptic's bear case. Price-implied growth and analyst expectations sit side by side on purpose. If the market is paying for 18% and sixty-three analysts have a median target 40% higher, someone is wrong, and the page makes you notice before you decide who.

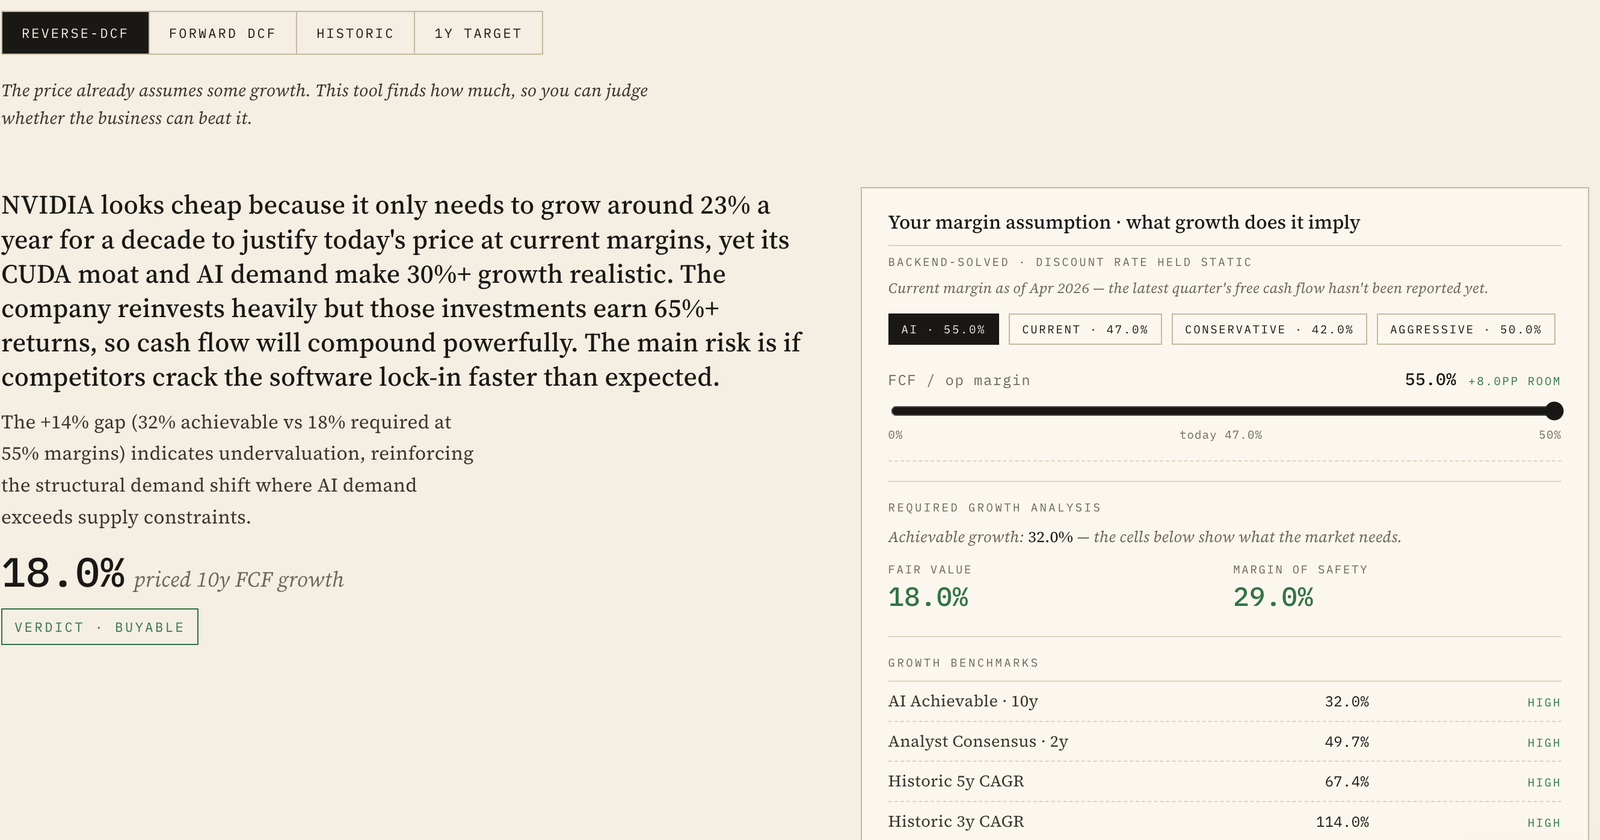
Below the reads sits the tool itself. The AI writes its case in plain language: what growth the price requires, what growth it believes is achievable and why, and a one-word verdict. The reasoning is the product. A number without an argument is just an anchor, so the model must always show which moat, which reinvestment economics, and which risk drive its achievable-growth estimate.
The assumptions are constrained on purpose. Margin comes from four presets (the AI's estimate, the current margin, a conservative case, an aggressive case) or from a slider bounded by what the business has actually done. The discount rate is held static. Contrarian scenarios, written by the AI to attack its own base case, load their growth and margin straight into the sliders with one click. You can disagree with the model, but you cannot torture it quietly: every number you move is visible, and the growth benchmarks below the sliders show what your assumption has historically required to sustain.
One more constraint matters. For binary-outcome businesses (a biotech waiting on a single trial, a company whose value hangs on one catalyst) a single implied growth rate is the wrong shape for the question, so the model switches to probability-weighted scenarios and says so. The tool tells you when not to trust it. That is the part a goal-seek cell in a spreadsheet will never do.
When does a reverse-DCF break down?
Early-stage companies where FCF is negative (no input), cyclicals at trough margins (the LTM FCF is a lie), and platform companies where current FCF understates intrinsic capacity (the model under-weights optionality). For these, layer reverse-DCF with normalised-FCF estimates, peer multiples, or, for true optionality, a separate scenario for the platform expansion. The reverse-DCF is one tool, not the only one.
The classic case where reverse-DCF goes wrong is Amazon circa 2010 — a model that read current FCF and projected forward would have rejected the price at almost every point along the run, because the model had no language for AWS not yet existing. The fix is to recognise reverse-DCF as a base-case discipline and to add a second scenario for genuine optionality where it exists. We've written more on that in the optionality post, linked below.
How does reverse-DCF fit into a margin-of-safety framework?
Margin of safety is the distance between the price you pay and the price you would consider fair. Reverse-DCF gives you the second number with sharper resolution than a forward DCF because it doesn't ask you to forecast twenty things. Once you have the implied growth rate, set it against the growth you believe the business can deliver: fair value is the price at which the two meet, and the margin-of-safety price is half of that fair value, the one discount the service applies to every name. The discount is your protection against being wrong about the growth rate, which you will be, on most stocks, most of the time.
The reverse-DCF is, in this framing, a margin-of-safety machine. It gives you the market's implied number; you compare it to a defensible forecast of what's achievable; the gap is the safety you have. A 50% gap (you think the company can do roughly half of what the market is paying for) is a punt. A 200% gap (you think the company will do twice the implied rate) is a position worth sizing.
What this means for your watchlist
Pick three positions you currently hold. Run a reverse-DCF on each. Compare the implied growth rate to the trailing five-year FCF CAGR. Anywhere the implied rate is above the historical rate, you are paying for an acceleration story, so make sure you can name it. Anywhere the implied rate is below the historical rate, you are owning a stock the market has implicitly given up on — make sure you can defend why they're wrong.