Reading the three statements
The income statement tells you what you earned. The cash flow statement tells you what actually hit the bank. The balance sheet tells you what you still own. The discipline of value investing is learning to read all three as one document.
A written underwrite collapses without the underlying numbers, and the three statements together are the underlying numbers. Peter Lynch's framing in One Up On Wall Street names the work: behind every stock is a company. Find out what it's doing. Phil Town's Rule #1 adds the operational frame — a company you can understand is a company whose three statements you can read in fifteen minutes. Buffett's contribution is restraint: never invest in a business you cannot understand. The three writers diverge on method and converge on the same handful of habits. This essay walks through those habits: one section per statement, anchored on the in-product editorial caption the Company page already ships above each waterfall, then extended with the famous-investor canon on what to look for.
How should a value investor read the income statement?
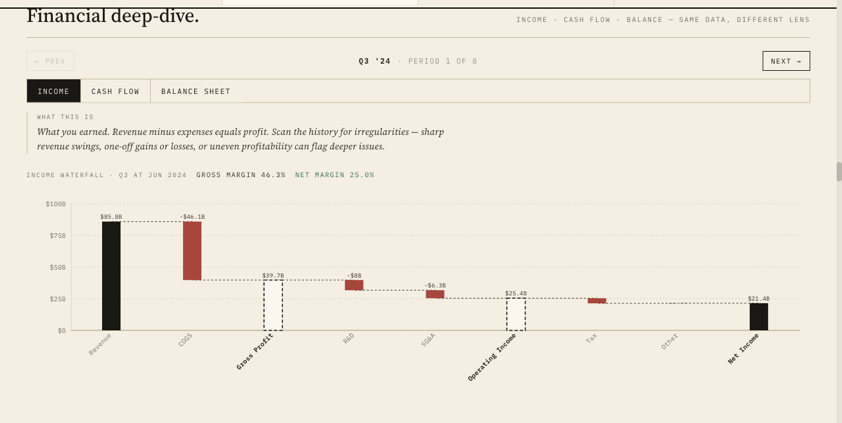
Top-down, not bottom-up. Revenue first: is it growing steadily, or is it lumpy with one-off jumps and resets? Then gross margin: is it stable across cycles? Buffett treats a durable gross margin as the receipt that pricing power is real; a margin that compresses every time input costs rise is a moat that isn't there. Then operating margin: is the business getting leaner with scale or fatter with overhead? Then net income, along with the questions about what got pulled out as "non-recurring" to get there.
What you earned. Revenue minus expenses equals profit. Scan the history for irregularities: sharp revenue swings, one-off gains or losses, or uneven profitability can flag deeper issues.
Gross margin is the single best read on whether the moat is real. Buffett returns to gross margin again and again in the Berkshire letters because companies with pricing power post gross margins that don't compress when input costs rise; the company eats the rise in cost of goods because it can pass the rise into price. A business whose gross margin halves the moment lumber, copper, or chip prices rise has, by definition, no pricing power. The figure below names the moat landmark explicitly: gross-profit and operating-income subtotals are the place to look first.
Lynch's instinct on earnings is the same instinct from a different angle: earnings should be smooth and rising; a chart of earnings going up year after year is your best clue to a stock that will be a winner. The smoothness matters because lumpiness usually traces back either to a cyclical business — which is fine if you know it's cyclical — or to one-off gains and losses being shovelled in and out of operating income to dress the print. Phil Town's Big-Five EPS rule (≥ 10% sustained over ten years) is the empirical companion: a business that actually translates a durable moat into shareholder return reads as a long line of compounding earnings.
The Buffett warning to keep alongside Lynch's smoothness rule is on non-recurring items. When management explains away two years in a row with “non-recurring” restructuring charges, the items are recurring; they are just being labelled in a way that keeps the operating line clean. The cleanest version of the income statement is the version where the reported number and the adjusted-for-everything number sit close together for a decade.
Why is the cash flow statement more important than earnings?
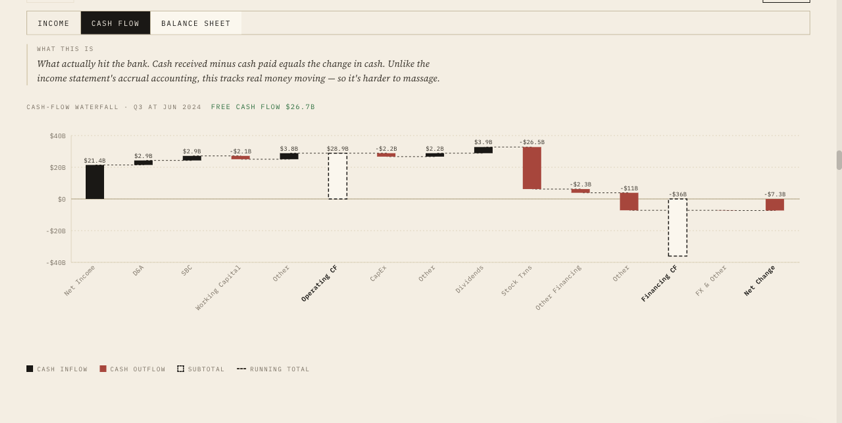
Because earnings are an accounting story and cash is a fact. Buffett's line, "earnings are an opinion; cash is a fact," names the practical problem: net income on the income statement is built from accrual accounting, where revenue is booked when earned (not when paid) and expenses are matched against it. There is judgement in every line. The cash flow statement, by contrast, tracks money actually moving: operating cash flow at the top, capex next, free cash flow as the residual. A business where net income is rising while operating cash flow is flat or falling is the classic warning sign that the income statement is being managed.
What actually hit the bank. Cash received minus cash paid equals the change in cash. Unlike the income statement's accrual accounting, this tracks real money moving, so it's harder to massage.
The statement strips the judgement out: net income at the top, non-cash charges (depreciation, amortisation, stock-based compensation) added back, working-capital movements next, operating cash flow as the subtotal, capex out, free cash flow as the residual. That residual is what the business actually has to fund dividends, buybacks, and acquisitions.
Phil Town's Big-Five free-cash-flow rule (≥ 10% sustained growth) pairs with the EPS rule to catch the specific failure mode where earnings rise while cash quietly drains. When both lines compound at 10%+ in lockstep, the income statement is telling the truth. When EPS grows at 12% while FCF grows at 2%, the income statement is being managed and the cash flow statement is exposing it.
The operational consequence of all of this is that every major accounting fraud of the past thirty years — Enron, WorldCom, Wirecard — was visible on the cash flow statement before the income statement turned. Enron's reported earnings rose for years while operating cash flow stayed flat; WorldCom capitalised operating expenses to flatter net income; Wirecard's “trust accounts” never appeared as real operating cash. The income statement told the story management wanted told. The cash flow statement told the truth.
What's the difference between net income and owner earnings?
Net income is the bottom line on the income statement: revenue minus every expense, including non-cash charges like depreciation and amortisation. Owner earnings is Warren Buffett's adjustment, defined in the 1986 Berkshire Hathaway letter to shareholders: net income, plus depreciation and amortisation (non-cash charges that overstate true wear on the business), minus the annual maintenance capex required to keep the business at its current competitive position. It is the cash a private owner could pull out of the business without compromising its position.
The reason the adjustment matters is that GAAP depreciation is rarely the same number as maintenance capex — for asset-light businesses (think software, brand-led consumer) owner earnings runs higher than reported net income; for asset-heavy ones (think utilities, miners) it runs lower. A reverse-DCF built against net income alone systematically over-values the asset-heavy and under-values the asset-light. Owner earnings is the cleaner input.
What should I look for on the balance sheet?
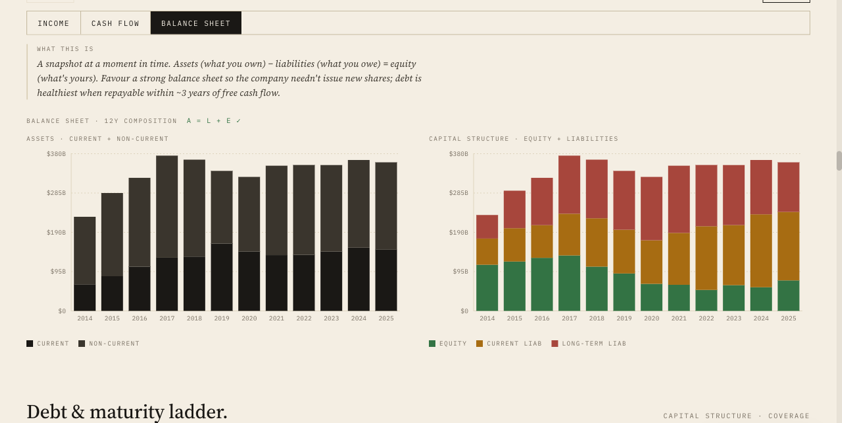
Three things, in order. First, debt: is long-term debt small relative to net earnings or free cash flow? Second, equity: is book value compounding year on year? That growth is the structural receipt that the business is funding itself from retained earnings rather than capital markets. Third, the working-capital reads: inventories not rising faster than sales, receivables not stretching, cash position growing. Even for a quality-compounder portfolio, a stretched balance sheet narrows the range of futures the business can survive.
A snapshot at a moment in time. Assets (what you own) − liabilities (what you owe) = equity (what's yours). Favour a strong balance sheet so the company needn't issue new shares; debt is healthiest when repayable within ~3 years of free cash flow.
Graham's Security Analysis codified the balance-sheet-first approach the modern compounder lens later softened. The original Graham net-net was a screen against book value: if a company's current assets minus all liabilities exceeded its market cap, the discount to liquidation value was the margin of safety. The modern reader rarely finds such names outside of Japan and a handful of small-cap pockets, but the discipline behind the screen is the right starting habit: start by asking what the liquidation value of the equity is, then ask what the ongoing earnings are worth on top. The balance sheet sets the floor under which the equity cannot reasonably trade for long.
Buffett's practical rule on debt is in the editorial caption above and worth expanding: long-term debt should be repayable from two or three years of free cash flow, and rarely more than five. Phil Town's analog in Rule #1 is the same instinct as a hard test: long-term debt under three times last-year free cash flow. The reason is not that debt is bad; the reason is that debt converts the business from a self-funding compounder into one that depends on capital-market access through every cycle. A balance sheet that can weather a recession without issuing new equity is the precondition for a long-term compounding thesis to actually run.
Lynch's balance-sheet reads in One Up On Wall Street are the working-capital instinct. Debt-to-equity reasonable. Cash position growing. Receivables not stretching faster than sales. And his most quoted balance-sheet line: inventories are the canary in the coal mine. When inventories rise faster than sales for two quarters running, the business is either building toward an expected demand surge that may not arrive, or watching demand quietly evaporate while the factory keeps producing. Either reading turns up first in the working-capital section of the balance sheet before it shows up in the revenue line of the income statement.
Phil Town's Big-Five equity-growth rule (book value compounding at ≥ 10%) is the structural receipt that the balance sheet is being built out of retained earnings rather than capital markets. Equity that grows from buybacks-out-of-debt or from new share issuance is not the same equity growth as equity that grows from retained net income. The first is balance-sheet engineering; the second is compounding.
How do the three statements connect?
Revenue from the income statement flows into operating cash flow on the cash flow statement after accruals are unwound. Operating cash flow minus capex is free cash flow: what the business actually has left to fund dividends, buybacks, and acquisitions. Net income flows into retained earnings on the balance sheet, building book equity period after period. The three statements reconcile if the business is being honest; when they don't, that is the signal a careful reader is hunting for.
When the three reconcile, the business reads coherently: revenue growth shows up as cash, cash invested shows up as growing assets, retained earnings show up as compounding equity, and the equity compounding rate is roughly ROIC times the reinvestment ratio.
When they don't reconcile is when the careful reader learns something. Revenue rising while operating cash flow stagnates is the receivables-stretching pattern: the company is booking sales it isn't getting paid for. Net income rising while retained earnings stay flat is the dividend-and-buyback-out-of-debt pattern, where the company is returning cash it didn't actually generate. Equity growing only because new shares were issued is the dilution pattern. The balance sheet looks bigger but each share owns less. Gautam Baid frames the precondition for all of this in The Joys of Compounding: financial literacy is the floor below which no serious analysis is possible. Without it, the underwrite is built on the surface of a press release.
What are Phil Town's Big Five Numbers?
Five rates of change, each ≥ 10% sustained over ten years: return on invested capital (ROIC), sales growth, earnings-per-share (EPS) growth, equity (book value) growth, and free-cash-flow (FCF) growth. The test is on the cover of Phil Town's Rule #1 because it is the simplest single filter a beginner can use to distinguish a quality compounder from a value trap before doing any qualitative work.
ROIC ≥ 10%: income statement (operating profit) over balance sheet (invested capital). The capital-efficiency test.
Sales growth ≥ 10%: income statement. The top-line durability test.
EPS growth ≥ 10%: income statement. The bottom-line-per-share test that catches dilution.
Equity (book value) growth ≥ 10%: balance sheet. The retained-earnings-compounding test.
Free cash flow growth ≥ 10%: cash flow statement. The is-it-actually-translating-to-cash test.
A business that passes the Big Five every year for ten years is, by construction, a business whose three statements rhyme. The test is useful precisely because it forces the reader to look at all three documents rather than letting the income statement carry the whole story.
Finding the statements in Invest Board
The Financial Deep-Dive section sits beneath the Trajectory strip on the Company page Value tab. Three tabs (Income, Cash flow, Balance sheet) each render the editorial waterfall shown in the figures above, with the plain-language “What this is” caption printed above each pane. The prev/next chrome at the top of the section walks through the last eight reported periods, quarterly and annual, so the reader can scan the trajectory of a single line item across multiple closes without leaving the page.
The same data that powers the reverse-DCF and the Trajectory headline numbers is being shown here as the raw input. Learning to read the waterfalls is learning to underwrite your own DCF inputs rather than trusting the AI's — the achievable growth rate and achievable margin used in the reverse-DCF model are derived from precisely the lines the income and cash flow waterfalls display. Reading the statements is the precondition for trusting the valuation.
Closing
The reader's job is not to memorise accounting rules; it is to develop the instinct for what the three statements are saying as one document. Buffett's never invest in a business you cannot understand applies here at the level of the numbers, not just the business. Lynch's smoothness instinct, Town's Big-Five one-screen test, Baid's financial-literacy framing — the practitioners diverge on method and converge on the same point: read all three. The income statement on its own tells you what management chose to report. The cash flow statement tells you what actually happened. The balance sheet tells you what was left at the end. The value investor reads them in that order, every time.