
What the AI portfolio has actually done
The score ranks 3,400 companies every week. A ranking is a claim, and a claim needs a test. So we run a paper portfolio of the top five in public, losers included.

Why does Invest Board run a fictive AI portfolio?
To answer one question honestly: do the companies at the top of the score actually perform? The scoring produces a ranked list of 3,400 names every week, and a ranked list is a claim. The only way to test a claim like that is to commit to it in advance and let it run in public, so we take the five highest composite scores, weight them equally, rebalance weekly, and publish every entry and every exit. It is a measuring instrument pointed at the score, not a product, not a fund, and not a recommendation. Nobody has money in it.
Every scoring system in this business is announced with confidence and audited by nobody. The categories sound sensible, the weights look considered, and then the results are never checked against anything. The cheapest way to be more honest than that is to place the bet in advance where everyone can see it: five names, dated entries, dated exits, and a benchmark beside them. If the top of the list is worth nothing, this is where it shows up first, and it shows up in public.
Should I invest the way the AI portfolio does?
No. The same properties that make it a clean experiment make it a poor template. Conviction has to come before capital, and conviction comes from understanding a business well enough to hold it when the price falls, which no ranking can give you. Sizing should follow risk and reward: the position you understand best, where the gap between price and value is widest, deserves more weight than the one you barely know. The book does neither. It cannot decline to buy, it cannot wait for a better price, and it cannot hold cash on purpose. Use the score to find candidates. Do the work before you own one.
This matters enough to repeat in plainer words. A high score is the beginning of research, not the end of it. Buying a business you have not understood means you have nothing to hold on to when the quote falls 30%, and the quote will fall 30%. The reason to read the moat write-up, the filings and the reverse-DCF is not diligence theatre. It is that conviction is the only thing that keeps you in the position long enough for the business to pay you.
Sizing is the second half of the same point. Money should follow the odds: more weight where you understand the business best and the gap between price and value is widest, less where the case is thin or the downside is unclear. The book's flat 20% is not a view about risk and reward. It is the absence of one, chosen so the experiment measures the score instead of measuring us.
How has the Invest Board AI portfolio performed?
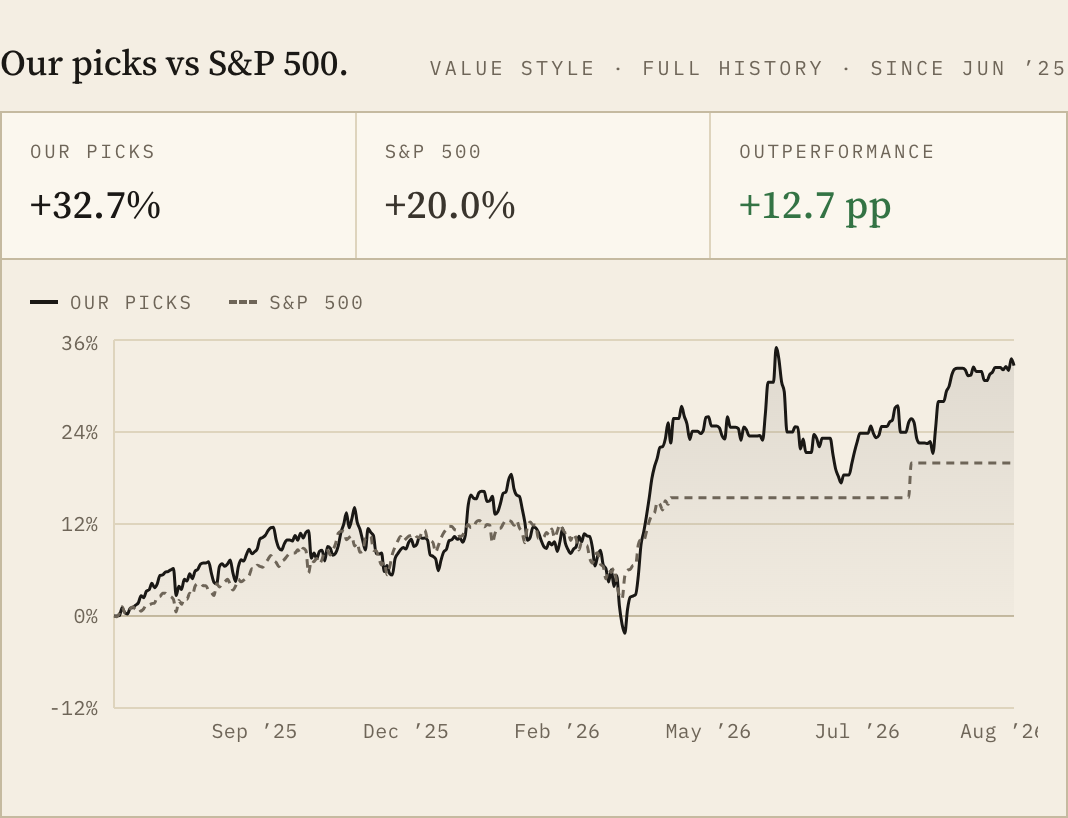
The value book started on 30 June 2025 at 10,000 and stood at 13,267 on 29 August 2026, a total return of +32.7%. The S&P 500 price index returned +20.0% over the same window, so the book is ahead by 12.7 percentage points, or 27.5% annualised against 16.9%. It travelled a rougher road to get there: 15.9% volatility against the index at 10.2%, and a worst peak-to-trough fall of 17.5% against 9.1%. Every number on this page is dated 29 August 2026 and comes from the same performance API the app itself reads, so the essay and the product cannot drift apart.
| Since 30 Jun 2025 | AI value book | S&P 500 |
|---|---|---|
| Total return | +32.7% | +20.0% |
| Annualised | +27.5% | +16.9% |
| Volatility | 15.9% | 10.2% |
| Worst drawdown | -17.5% | -9.1% |
| Share of up days | 41.4% | 35.1% |
Return without the drawdown beside it is a story about a ride nobody actually took, so both are here. The book is up on more days than the index and falls harder when it falls, which is what a five-stock portfolio does. On the risk-adjusted ratios the index wins this window, and we are not going to build the page around that, because volatility is a measure of discomfort rather than a measure of risk. The risk that matters to an owner is permanent loss of capital, and the defence against it is the price you pay, not the smoothness of the line. Buffett said he would rather have a lumpy 15% than a smooth 12%. This book is the lumpy line, and the whole method is built on preferring it.
How is the AI portfolio constructed?
It holds the top five names from the value screen, equal weighted at 20% each, with the remainder in cash. Ranking is the composite score: moat, risk, valuation, optionality, management and business model, the same score the company pages show. The book rebalances weekly: the screen refreshes, the ranking is re-read, and the book resets to the new top five at 20% each. When a name drops out of the top five it is sold in full and the new name is bought at 20%. Positions close on a Sunday and open on the Monday, which is why the ledger dates line up the way they do. There is no discretion in the loop, no sizing by conviction, and no override when the machine picks something uncomfortable.
The composite that does the ranking is documented in full on the scoring methodology page: which categories exist, what each one weighs, which data feeds it, and what a score cannot see. The machines page covers the layer underneath, the analysis agents that read filings and write the category reasoning before any number is assigned. If you want to disagree with this book, those two pages are where the argument actually is.
How does equal weighting affect the results?
It makes the measurement cleaner and the strategy worse. Equal weights remove the easiest way for a track record to flatter itself, which is putting the largest weight on the name that happened to work, so what you see is the score talking rather than a sizing decision. But equal weight plus a weekly reset means the book sells strength and buys weakness inside its own top five: a position that runs gets trimmed back toward 20% and a position that lags gets topped up. Nvidia does not dominate the book despite being its best-known name, because it has been cut back to 20% every week it stayed in the top five, and sold outright in the weeks it fell out. A real owner would let a compounder run.
It is worth seeing what that costs. A buy-and-hold version of the same five names would look different, probably better in a market where one winner runs, and it would tell you less, because the result would then depend on which name happened to be the winner. The trade is deliberate: the book gives up the compounding tail in exchange for a result you can attribute to the ranking. That is the right trade for an experiment and the wrong one for a portfolio you own.
The book, position by position
Five positions are open. Forty-one have been closed. That is what a weekly rule produces over fourteen months, and publishing the closed ones is the part that matters, because a track record showing only current holdings is a survivorship bias machine: sell the mistakes, forget them, and the remaining portfolio looks like genius.
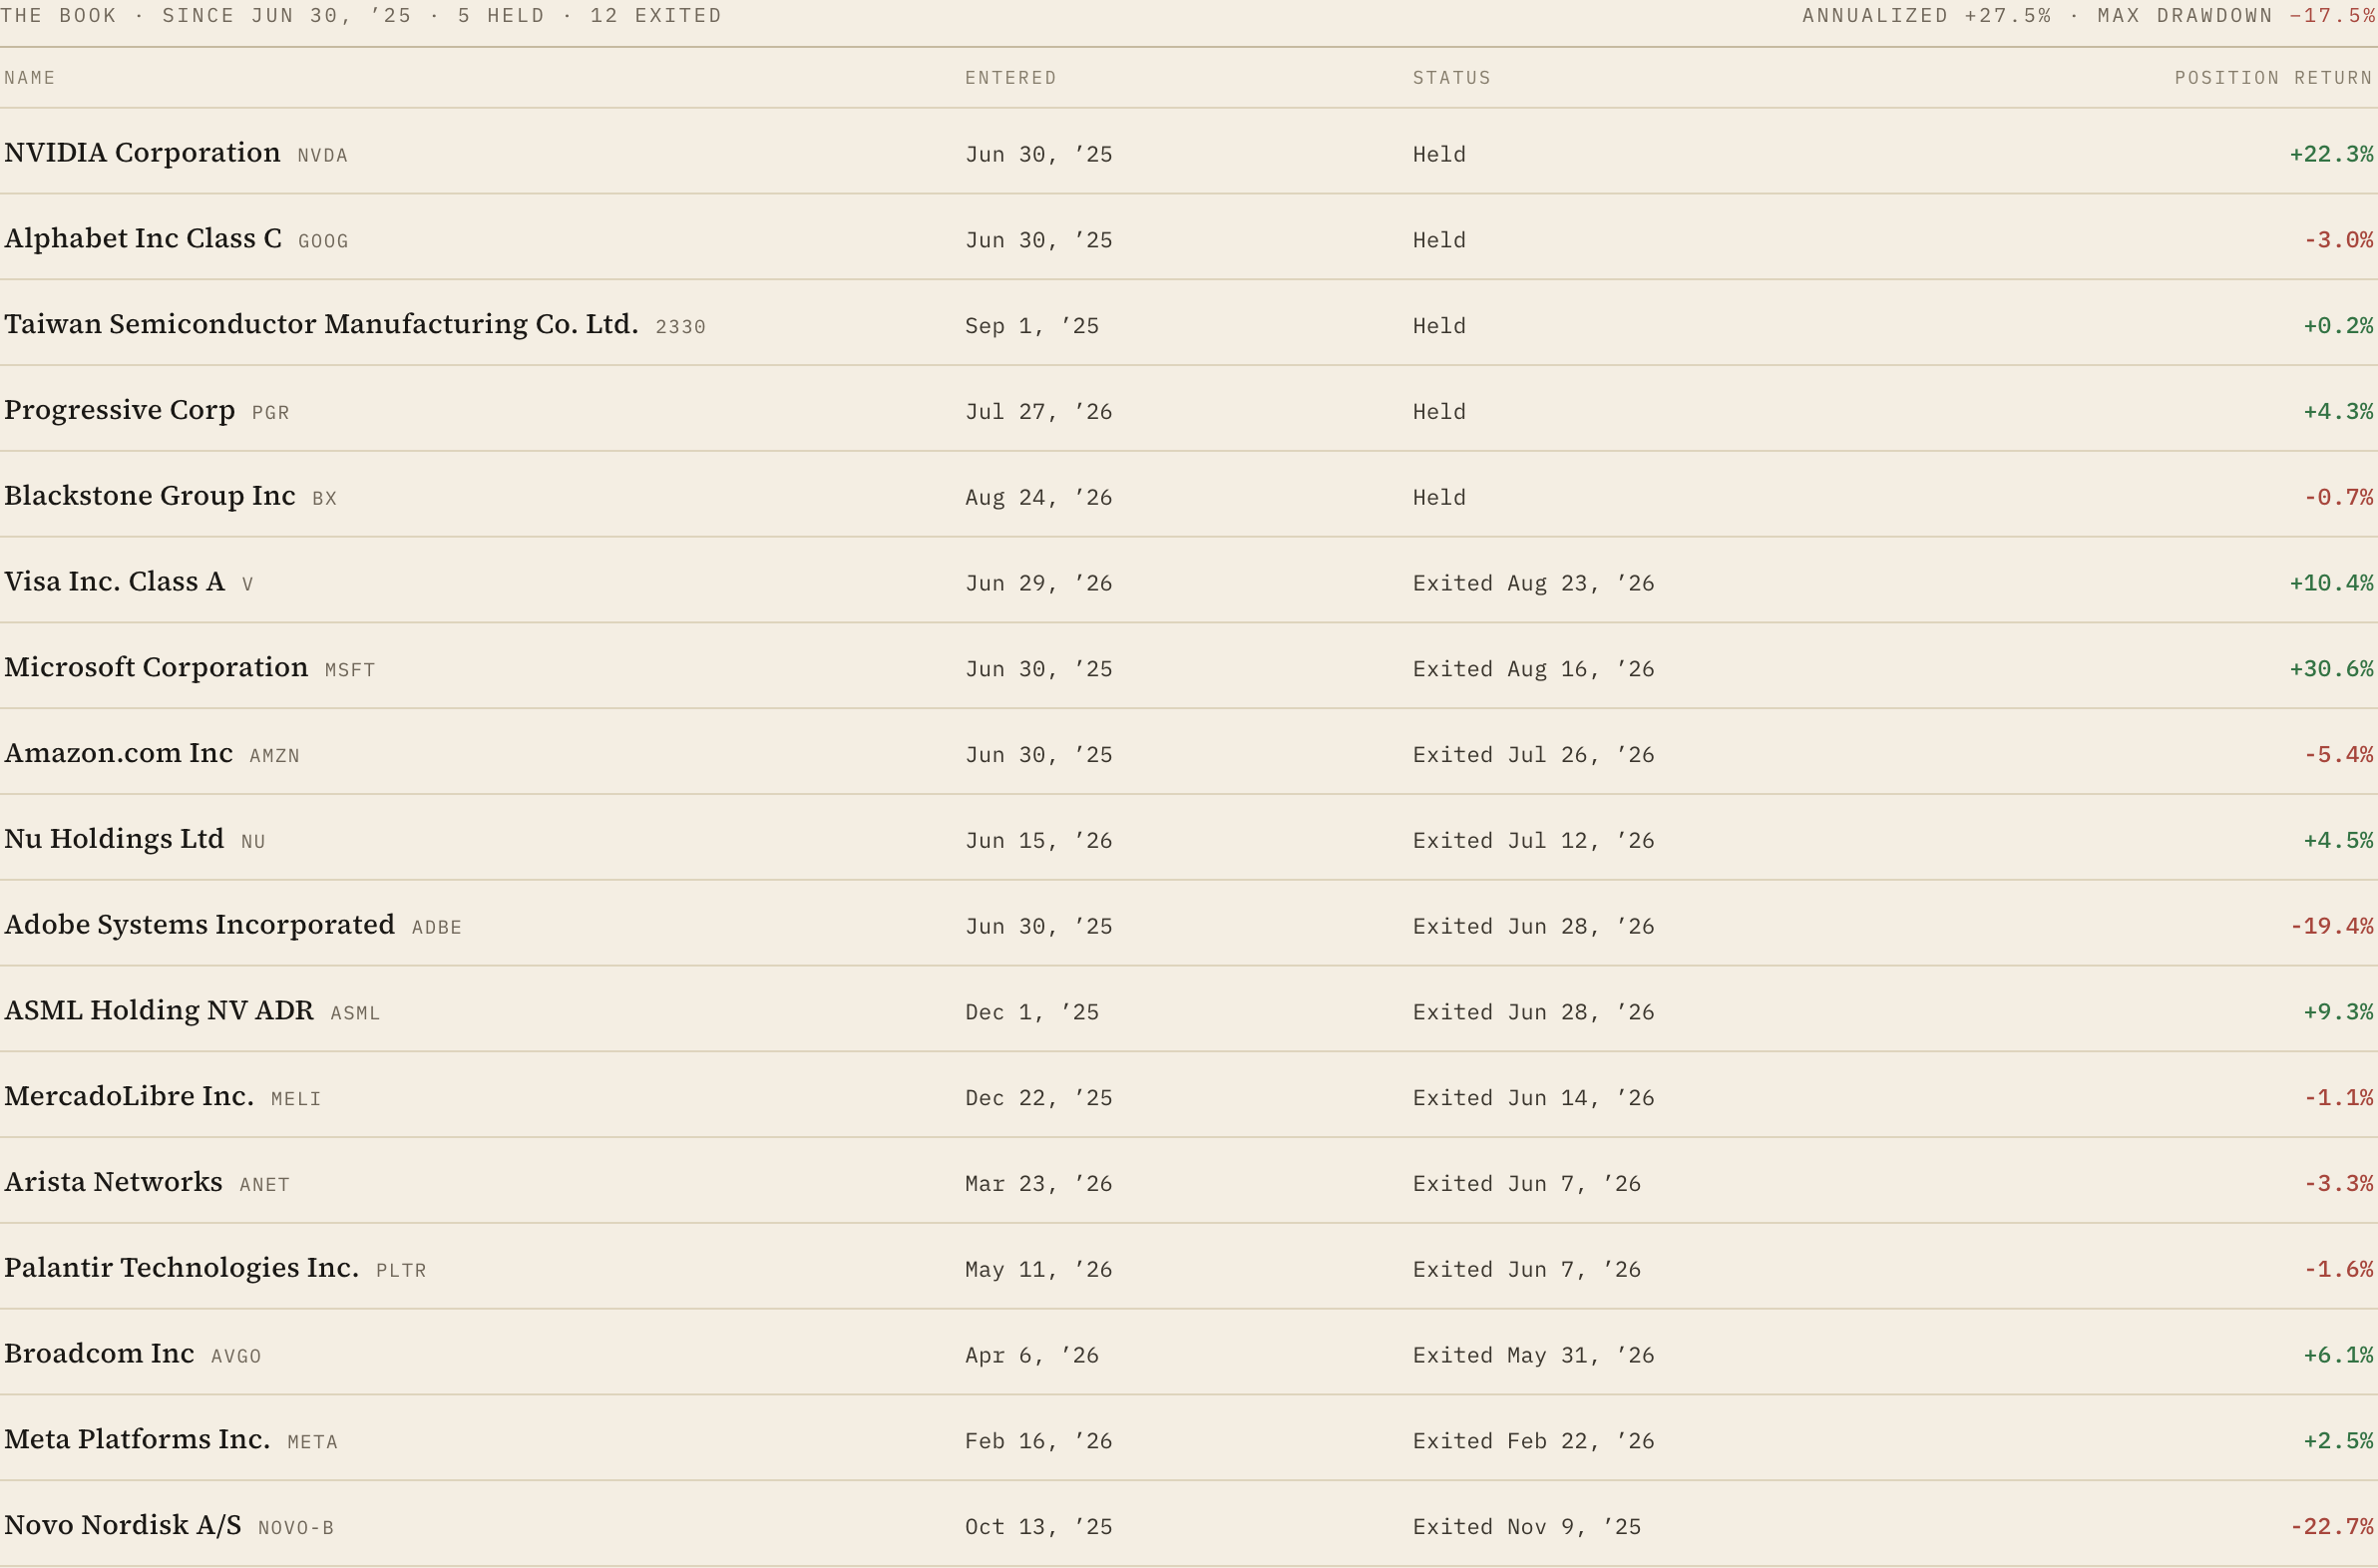
Of the forty-one closed positions, twenty finished up and twenty-one finished down. The best was Alphabet at +82.1%, held from the first day of the book until it fell out of the top five in December 2025. The worst was Novo Nordisk at -22.7%, owned for four weeks in late 2025 and cut. A hit rate slightly under half that still beats the index is the ordinary arithmetic of investing: the winners were allowed to run further than the losers fell.
The five open positions are all younger than the book itself. Nvidia has been held since 9 March 2026 and is up 22.3%. Taiwan Semiconductor entered on 13 July, Alphabet on 10 August, Progressive on 17 August and Blackstone on 24 August. Each of those returns is measured from the current entry, which matters more than it sounds: Alphabet has been bought and sold five separate times, and its first holding period is the best result in the whole book while the one it is in now is slightly down. Turnover like that is a consequence of the rule, not a view about how long a good business should be held.
What happened in the drawdown?
The book peaked on 29 January 2026 and bottomed on 31 March 2026, down 17.5%. The index fell about 9% over roughly the same stretch. By the end of March the book was behind the index for the year to date, and it stayed behind until the spring. It recovered because two positions did the work, not because the process changed. The worst single day was 6 June 2026 at -4.1%; the best was 9 April 2026 at +3.8%.
Look at the chart at the top of this page and the shape of the year is obvious. For seven months the book and the index are the same line. Then a two-month decline that hurts more than the index does, then a step up in April that opens the entire gap. Almost all of the outperformance in this window arrives in a handful of weeks. That is how concentrated books work, and it is exactly why a 14-month sample cannot tell you whether the process is sound.
Is 14 months long enough to judge an investment process?
No, and it is not close. The standard result in the literature is that separating skill from luck takes decades, not quarters: for a manager running roughly market-level volatility, a track record long enough to make a 5% annual edge statistically significant runs into the tens of years, and ten years of outperformance can still be noise. So treat 14 months as evidence that the process runs, that it exits losers, and that it does not quietly hide them, rather than as evidence that it works. The value of publishing early is the audit trail, not the number at the top.
The arithmetic is unforgiving. If a strategy's true information ratio is 1, you need roughly four years of live results before two standard deviations of statistical confidence, and information ratios of 1 are rare. Research on manager evaluation puts three-year outcomes at overwhelmingly luck-driven. A book with five positions makes the sample problem worse, not better, because a handful of large bets carries a large standard error.
So the claim on this page is deliberately small. The book exists, it runs by rule, its exits are dated, its losers are listed, and after 14 months it is ahead of the index. That is all the data supports. Ask again in five years.
Can AI pick stocks better than humans?
The research says the honest answer is neither, alone. Machine analysts beat humans only slightly more than half the time in the academic studies, because a model reads numbers well and understands business context badly. The strongest published result is for the combination: human-plus-machine setups avoid the vast majority of each side’s extreme errors. That is the design here. The machine reads everything and ranks; the book tests the ranking in public; and the method insists a human forms conviction before any real capital moves. This page is the experiment, not the advice.
Fourteen months of one book cannot settle that question either way, which is why the claim stays small. What the combination argument explains is the division of labour on this page: the ranking is machine-made because reading 3,400 companies weekly is machine work, and the conviction stays human because holding through a 17.5% drawdown is not a computation.
What do these performance numbers exclude?
Trading commissions, bid-ask spread, slippage and taxes are not modelled. Dividends are not credited, on either side: the benchmark is the S&P 500 price index, so the comparison is like for like but both figures understate a real total return. Positions are marked at the daily close, which is the same end-of-day basis the rest of the app uses. It is a model book, not a brokerage statement, and it is published as one.
One more limitation worth naming: the book trades on end-of-day closes, and the screen it draws from refreshes weekly, so it cannot claim any intraday skill and does not try to.
Follow it live
This is not a quarterly letter. The panel at the top of this essay and the ledger above are both live surfaces inside Invest Board: open the Discover page, switch to study mode, and the desk's current list sits beside the picks-versus-S&P chart with the full book underneath it, entries, exits and losers, updated daily at the close.
Watching it is the point. If the top of the score is worth something, this is where the evidence accumulates, one dated position at a time. If it is not, this is where that becomes obvious first. General investment analysis, not personalised advice.