
Small-Cap Margin Expansion
The story most small-cap multi-baggers tell on a chart is, underneath, almost always margin expansion that the market took two years to catch up to.

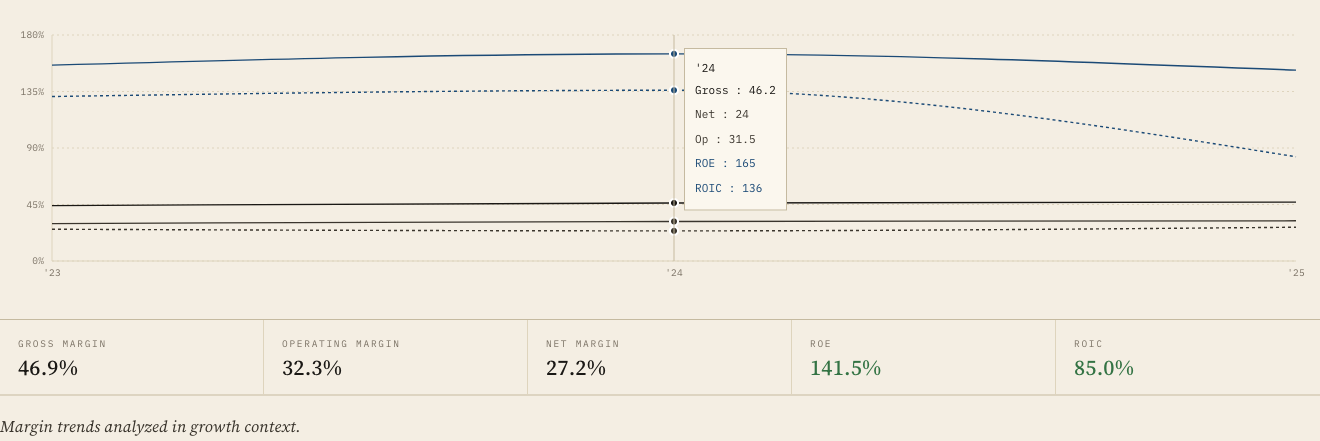
What is margin expansion and why does it drive small-cap returns?
Margin expansion is the widening of operating margin over time as revenue grows faster than the underlying cost structure. In small caps with significant fixed costs (R&D, head office, distribution infrastructure), every additional unit of revenue drops a higher proportion to operating profit. The arithmetic compounds: 20% revenue growth on a business expanding operating margin by 300 basis points a year produces multi-bagger returns over five years even without multiple expansion. The story most multi-baggers tell on a chart is, underneath, almost always margin expansion.
The classic recent example is a small Nordic software business compounding revenue at 15% a year while operating margin moves from 7% to 30% over five years. The earnings growth is not 15%; the earnings growth is more than 60% annualised because the leverage compounds on itself. Add even modest multiple expansion as the market belatedly re-rates the higher-margin business and the five-year return on the entry price is six- to eight-bagger territory. None of this is sorcery — it is the arithmetic of fixed costs being absorbed by a growing top line, working over time.
How do I identify a candidate for margin expansion?
Three signals. First, current operating margin is meaningfully below long-run peers or the company's own historical mid-cycle. Second, the cost base has a large fixed component (R&D, sales infrastructure, manufacturing) that should not need to scale linearly with revenue. Third, management has a specific operational plan: a programme of SKU rationalisation, a new distribution channel, a cost-out initiative with named savings targets, or a price-increase opportunity the market structure permits. The candidate fails fast if any of the three is missing.
The screening signal is unflashy: trail twelve-month operating margin at the lower end of a five-year range, revenue growth positive but not spectacular, gross margin stable or rising, and a management commentary in the most recent annual report that names the operational programme in specific language. If you cannot find the named programme in the report, the bet is on a story management has not committed to in writing, which is a worse bet than the market thinks.
How is margin expansion different from operating leverage?
Operating leverage is the structural property of a business: the relationship between fixed costs and variable costs that determines how revenue translates to profit. Margin expansion is the outcome of operating leverage actually working: revenue scaling faster than costs over a multi-year period. Every business has some operating leverage; not every business produces margin expansion. The difference is execution: a management team that runs the lever (pricing, mix, productivity) versus one that lets the lever sit idle while costs creep up alongside revenue.
The implication for stock-picking is that operating leverage on its own is not a thesis. Lots of businesses with high fixed costs run flat margins for a decade because the management team is comfortable letting costs grow with revenue. The thesis requires not just the structural lever but the operator pulling it. Where you do find both, the returns are larger than anywhere else in the small-cap universe, because the market has under-priced the execution. The scoring methodology we use treats management as one of the six dimensions for exactly this reason.
What is a realistic margin-expansion path for a small cap?
For a well-run small cap with genuine operating leverage, 200–400 basis points of operating margin expansion per year over three to five years is achievable. The progression usually looks like: year one, the cost programme bites and margin moves 100bps; years two and three, the revenue side accelerates and the fixed-cost dilution does most of the work, adding 150–250bps annually; years four and five, the expansion slows as the easy wins are exhausted and the business reaches steady-state margin. Beyond that, expectations should normalise toward peer averages.
The realistic path is also a useful kill criterion. A margin programme that has not produced 100bps of expansion by the end of year one is one that is not going to produce the full path. The first print is the highest-signal data point, because the easy wins (SKU rationalisation, supplier renegotiation, redundant headcount) are the ones that should land first. If they do not, the thesis is at risk and the position size should be cut, not held into the next quarter.
Why does the market often miss margin expansion in small caps?
Two reasons. First, the analyst coverage is thin — many small caps have one or zero sell-side analysts, so the operational story is not told to the market continuously. Second, the historical margin is what screens show, and the market is anchored to the recent past. Once the margin starts to expand, the analyst models lag the reality by two to four quarters; the market re-rates only after the new margin shows up in two or three consecutive prints. The patient investor who underwrites the expansion before the re-rate captures the gap.
The lag is the opportunity. The investor who reads the annual report, listens to the conference call, and underwrites the margin path before the analyst community catches up is buying a position the market will re-rate over the next eight to twelve quarters. This is the cleanest example of the informational edge a small investor has over a large fund: the fund cannot own a 50 million market-cap position; the small investor can, and is competing against an analyst community that has structurally less coverage on those names.
What is the difference between margin expansion and a pricing-power bet?
A pricing-power bet assumes the company can raise prices faster than costs because brand or product differentiation gives it that latitude. A margin-expansion bet assumes the company can grow revenue while holding costs roughly flat. The two are not mutually exclusive (some businesses have both), but the underwrites are different. Pricing power is a story about competitive moat. Margin expansion is a story about operating leverage. Mistaking one for the other produces theses that survive in a presentation and fail in the income statement.
The reason it matters is that the bets fail in different ways. A pricing-power bet fails when a competitor underprices, or a substitute emerges, or the customer base becomes more price-sensitive. A margin-expansion bet fails when management executes badly — costs creep, the programme slips, the operational targets miss. The risk frameworks for each are different, and diagnosing which kind of bet you are actually making is the first step in defending it.
How do I size a position betting on margin expansion?
Smaller than your typical bottom-up position, because the variance of the outcome is wider. Even when the operational logic is sound, margin programmes take longer than management forecasts, and the gap between forecast and delivery is where most small-cap disappointments live. Three to five percent of book is appropriate for a high-conviction margin-expansion thesis; adding to the position as the first one or two prints validate the underwrite is a better path than sizing in fully at the start.
The discipline of adding as the underwrite validates is one of the most underrated risk-control techniques in concentrated investing. It allows you to size higher in the names where the thesis is actually working without sizing fully in the names where it might not. The path through a margin-expansion thesis is a sequence of decisions, not a single one — and the later decisions, made with more information, are the ones where the position should grow.
What this means for your watchlist
Run a screen on small caps in your circle of competence with operating margin in the bottom quartile of their five-year range, revenue growth positive, and gross margin stable. For each name that surfaces, read the most recent annual report and look for the named programme. The names that pass are the candidates. The deeper work (reading the proxy on management compensation, listening to two years of conference calls, checking competitor responses) is what turns a candidate into a position. None of that work is glamorous. All of it is where the multi-baggers come from.