Commodities and cyclical investing
Commodities don't compound. They cycle. The edge lives in supply, not demand: understanding the capital cycle the rest of the market is busy ignoring.
What is cyclical investing and how does it differ from compounder investing?
Cyclical investing means owning businesses whose earnings, returns on capital, and valuations are driven by supply and demand rather than by a durable competitive advantage. The price of the underlying product sets the margin, and the margin sets the multiple. It makes no difference whether the product is copper, oil, freight rates, memory chips, fertiliser, or container shipping. That makes the work fundamentally different from owning a compounder. A quality compounder's edge is structural: a moat that lets the business reinvest at high returns regardless of where the broader cycle is. A cyclical's edge is positional: buying when capacity is leaving the market, capex is depressed, and sentiment is hated, then selling before the new capacity that high prices invited actually arrives. Both can compound capital, but the disciplines barely overlap.
Commodity and cyclical businesses operate on a different physics: they have limited pricing power, they cannot reliably reinvest capital at high returns, and their margins are set by a market that adjusts on a multi-year delay. Owning them well requires a different framework built around the capital cycle, the cost curve, and the supply response, along with a different sell discipline. Howard Marks's work on cycles, Mohnish Pabrai's work on the cost curve, and Gautam Baid's chapter on commodities in The Joys of Compounding all point at the same handful of ideas. This is one practitioner's distillation of them.
How can I follow the commodity cycle inside Invest Board?
The Discover page is built for this. The MACRO tab carries twelve indicators that track where the broader economy sits in the clock, covering credit conditions, capex trends, inflation, and employment dispersion. Together they give a single read on whether the regime favours cyclicals or defensives. The PICKS tab then filters the universe down to the names that pass today's setup, ranked by composite score against the lens you've selected. The cumulative-return chart at the top, labelled Our picks vs S&P 500, is the discipline check: are the curated names actually outperforming the index, and over what window? Together they let you watch the cycle, the picks, and the result on one screen.
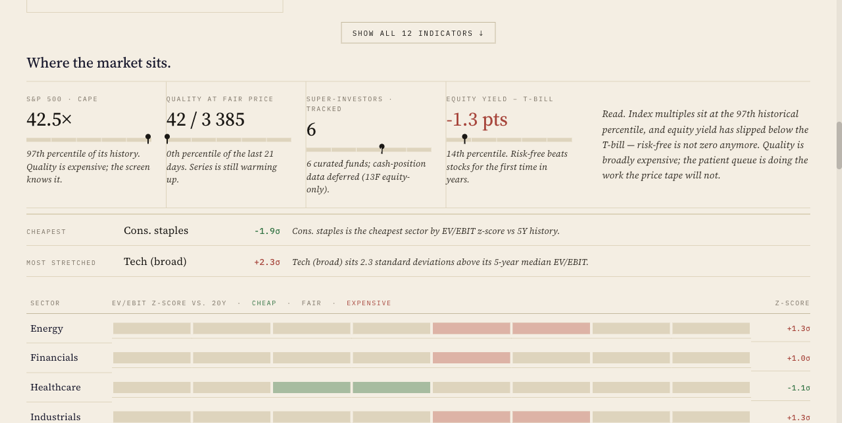
Before the theory, the surface. The figure above is the section most directly useful to a cyclical investor — Where the market sits, inside the Macro tab. The four indicator cards at the top deliver the regime read in a single glance: S&P 500 CAPE at the 97th percentile of its history, quality compounders sitting at the 0th percentile of recent fair-value affordability, super-investor cash positions tracked across six curated funds, and the equity-yield-minus-T-bill spread sitting at −1.3 percentage points — a number that has only been negative a handful of times in modern history. Together they answer the opening question of any cyclical-investing decision: is the regime hospitable, or is the broader market priced for an outcome that leaves no room for disappointment?
Below the regime cards, the sector EV/EBIT z-score heat strip is the workbench. Each row is a sector; each cell is a half-σ band of valuation relative to the sector's own five-year history. Green means the sector trades cheap on EV/EBIT; red means stretched. The cheapest row at capture time was Consumer staples (−1.9σ); the most stretched was Technology (broad, +2.3σ). The dispersion is the point. Cyclical setups rarely live in the middle of the curve — they live in the cheap tail, where capacity is leaving the market and capex has been cut to maintenance. The Macro tab's full panel of twelve indicators sits one click below for the depth read, and the Sector trend depth view lets you check whether a specific sector multiple is at a 5- or 10-year extreme before you commit to a name. The rest of this piece is the framework you can apply against what the page is telling you.
The cycle in plain terms
The cure for high prices is high prices.
The cure for low prices is low prices.
High prices invite new supply. Greenfield projects get approved, marginal capacity is brought back online, and within a few years the industry is producing more than the market can absorb. The new capacity arrives late. That is always the rule with capex, and when it does, prices fall, projects get shelved, and the cycle starts to turn. Low prices do the opposite. Companies close their highest-cost operations, capex is cut to maintenance, and the supply pipeline empties. Eventually demand catches up to a smaller supply base, prices rise, and the next cycle begins. The rhythm is mechanical. What changes from cycle to cycle is the duration and the amplitude, not the shape.

Why focus on supply rather than demand in commodities?
Demand is what everyone forecasts, which means demand surprises are mostly already in the price. Supply is harder to model, slower to change, and less covered, which is exactly why it carries the edge. A new mine takes seven years to permit and build. A new ship takes two. A new fab takes three. Once a downcycle has run long enough to shut projects in, the supply response takes years to reverse. During those years, the price discovers a new floor.
The key questions are about industry capacity:
- Is industry capacity expanding or shrinking?
- Are competitors adding new projects or cancelling them?
- Is industry capex increasing or decreasing?
- Has the industry underinvested for several years — long enough that the cost curve has shifted and the marginal producer has changed?
The best opportunities almost always emerge after prolonged periods of underinvestment. The reason is structural: once capex has been absent for years, even a modest improvement in demand has nothing on the other side to absorb it, and the price discovery happens fast.
When is the right time to buy a cyclical?
The best cyclical purchases feel uncomfortable at the point of entry — the conditions that make a sector look unownable are the same conditions that suppress new supply, which is what lays the foundation for the next upcycle. The discipline is to size around a thesis that is structural rather than emotional: the cost curve has flattened, the marginal producer is closing, and the supply response that will eventually rebalance the market is years away.
Look for industries where the setup reads as follows:
- Sentiment is negative; headlines lean bearish.
- Earnings are depressed.
- Capacity is leaving the market.
- Industry capex is low.
- Supply growth is slowing.
- Companies are cutting expansion plans rather than announcing them.
The setup sounds like a list of reasons to avoid the sector — that discomfort is the price the market is charging for the structural setup. Buying when conditions are bad but improving is the rule; waiting for the cycle to be obvious means buying after the easy re-rating has already happened.
Should I prefer low-cost producers or higher-cost turnarounds in an upcycle?
Both work, but they're different bets. Low-cost producers survive the trough — they avoid permanent capital loss in the next drawdown and can keep reinvesting through the cycle. Higher-cost producers and turnarounds deliver the largest re-ratings when the cycle turns because the move from losses to profitability compresses years of earnings recovery into a few quarters. A common mistake is to assume both can be owned the same way; the position size and the kill criterion should look very different on the two.
The position-sizing implications run in opposite directions: the low-cost producer is a structural compounding bet that can be sized more aggressively, particularly when the timing of the cycle is uncertain, while the turnaround is a leveraged bet on cycle timing that should be sized smaller and exited faster.
The split, in summary:
- Low-cost producers generally provide better risk-adjusted returns and can be held through more than one cycle.
- Higher-cost producers and turnarounds may provide higher absolute upside in an upcycle, but the risk of permanent capital loss is meaningfully larger if the cycle disappoints.
Good management thinks in terms of the cycle, not the quarter. It raises capital near the top of the cycle, when the stock is expensive and money is cheap and easy to get, and deploys that capital — or simply leans on a strong balance sheet — to acquire distressed competitors near the bottom, when assets are cheap. The same discipline shows up in capex timing: reluctance to commit major spending near the top, when construction costs are inflated and every competitor is building the same project, paired with a willingness to build near the trough, when it's cheap and the industry has stopped bidding against itself. This is where the moat concept actually earns its keep in this asset class. Being the low-cost producer isn't a fixed structural advantage handed down for free, the way a brand or a network effect can be. It's a position that gets compounded or eroded by exactly these capital-allocation decisions, cycle after cycle.
Debt is what turns a bad quarter into a permanent loss. A cyclical business carrying even moderate leverage can be forced into asset sales, dilutive equity raises, or bankruptcy during a downturn that a conservatively financed competitor simply outlasts, and outlasting the trough is most of the return: the survivors are the ones who buy the casualties' assets cheap. Oil and gas makes the point concretely. The balance sheet alone isn't enough to judge; the reserves matter just as much. A useful lens is reserves per share against the all-in cost to extract each barrel. A producer with deep, cheap reserves can fund its own trough and still be standing to buy when others are selling. One without those reserves is not a value investment at all, just a leveraged bet on the oil price with no margin of safety underneath it.
When do successful cyclical investors sell?
Earlier than amateurs do. Most investors sell when earnings start falling, and by then the stock has already peaked. The rule that works better is to sell when conditions are good but no longer improving, and the signals come from supply, capex, and margins, not from the headline earnings line.
Three variables lead earnings by several quarters:
- Margins.
- Earnings revisions.
- The supply response — capex announcements, new project approvals, returning capacity.
The useful rule:
Buy when conditions are bad but improving.
Sell when conditions are good but no longer improving.
The warning signs that the trade is over:
- Margins stop expanding.
- Earnings growth starts slowing.
- New capacity enters the market.
- Industry capex accelerates.
- Management becomes highly optimistic.
- Investors begin to justify valuations on peak earnings, as if the cycle has been abolished.
The stock typically peaks four to eight quarters before earnings peak. By the time the headline print rolls over, the market has already discounted the supply response that is about to land.
Commodity investing checklist
Buy when:
- Industry is hated
- Capacity is leaving the market
- Industry capex is depressed
- Supply growth is slowing
- Balance sheet is strong enough to survive the rest of the trough
- Valuation is attractive on normalised earnings, not trough earnings
Sell when:
- Industry is loved
- Margins stop improving
- New supply is entering the market
- Industry capex accelerates
- Management becomes overly optimistic
- Investors assume current conditions will persist indefinitely